screenshot 2026 03 06 at 2.43.20 pm

Building an AI Content Machine with n8n

The Content Consistency Problem Every Marketing Team Faces

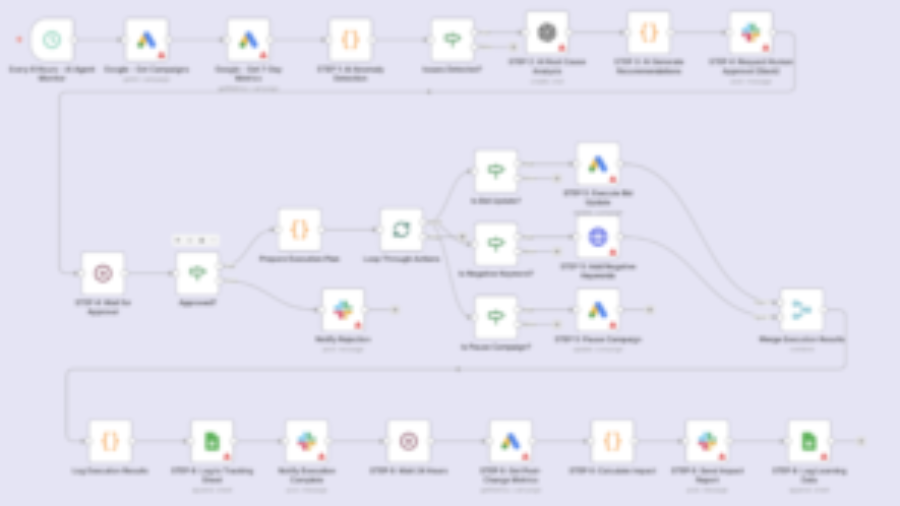
Content marketing works — but only if you’re consistent. The AI Posts Content Machine I built with n8n changes the equation. It’s a 31-node automation workflow that researches trending topics, generates content ideas, scores and rewrites them using AI, and publishes across Instagram and X (Twitter) — fully automatically, on a schedule you set.


How the Workflow Works: End-to-End

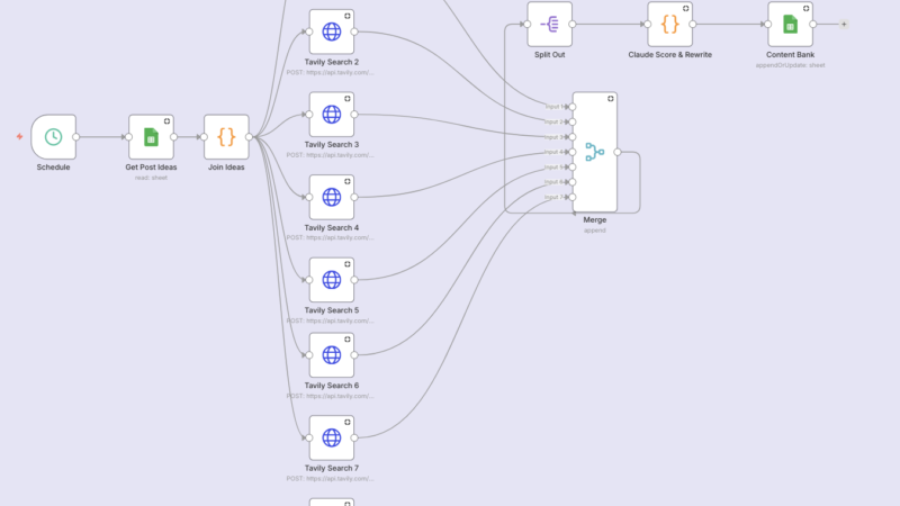
Stage 1: Idea Generation and Research

The workflow starts with a Content Bank (Google Sheet or Airtable) where you seed topics and keywords. Every run, it pulls ideas and uses Tavily Search (7 parallel searches) to research what’s trending around each topic.

Stage 2: Post Drafting

The Pick One node selects the strongest content angle. An OpenRouter Chat Model node generates the initial post draft — optimized for the target platform’s format, character count, and engagement patterns.

Stage 3: AI Scoring and Rewriting

The Score and Rewrite node sends the draft to Claude with a detailed scoring rubric: hook strength, value density, platform-fit, and CTA clarity — all scored 0–10. If any score falls below 7, Claude rewrites that element automatically.

Stage 4: Scheduling and Status Management

Approved posts are stored in the Content Bank with status “Ready.” The Get Ready Posts node polls for ready posts and queues them for publishing. The Update Status node marks posts as “Published” after distribution to prevent duplicates.

Stage 5: Multi-Platform Publishing

Publishes to X (Twitter) via the X API, and to Instagram via a three-step process: Create Media Container → Wait for Processing → Publish Post.


What You Need to Set This Up

  • n8n (cloud ~$20/month or self-hosted)
  • OpenRouter API key for multi-model LLM access
  • Anthropic API key for Claude scoring
  • Tavily API key for real-time web search (free tier available)
  • X Developer Account with API access
  • Meta Business Account with Instagram Graph API access
  • Google Sheets or Airtable for the Content Bank

Estimated monthly cost: ~$35–65/month to run a fully automated content operation. Compare that to a junior content creator at ₹25,000–40,000/month.


The Human Layer

Spend 30 minutes per week seeding new topics. Review AI-drafted posts before they publish. Add brand-specific examples and proprietary data to your system prompt. The goal is a human-in-the-loop system — you retain creative direction, AI handles the production grind.


Download the Workflow

The complete AI Posts Content Machine workflow is available for download on my Resources page. Setup time: approximately 3–4 hours for a technical marketer. Payback time: day one.

Prajesh Meshram is a Senior Marketing Leader and marketing automation practitioner. Download his complete n8n workflow collection at the Resources page.

screenshot 2026 03 06 at 2.42.39 pm

Building an Enterprise Marketing Platform from Scratch

What Enterprise Marketing Automation Actually Looks Like

Enterprise marketing automation is a connected intelligence layer that monitors your entire go-to-market operation in real time, enriches every lead automatically, scores and routes them without human intervention, delivers daily performance reports, and alerts your team the moment something breaks.

The Complete Enterprise Marketing Platform I built with n8n is a 63-node workflow that does exactly this.


The Five Systems in One Workflow

System 1: Real-Time Campaign Performance Monitoring

Monitors Google Ads and LinkedIn Campaigns every 6 hours automatically. If CPA exceeds 150% of target or CTR falls below 0.5%, an underperforming alert fires to Slack immediately. If zero conversions are detected, a critical alert fires. Find out about underperforming campaigns in hours, not days.

System 2: Automated Lead Enrichment

Every new lead is automatically enriched with company data (size, industry, revenue, tech stack) and person data (job title, seniority, LinkedIn profile) via Clearbit before any human touches it. Enriched leads enable accurate lead scoring and faster sales qualification.

System 3: Lead Scoring and CRM Automation

Leads go through an automated scoring engine combining firmographic data with behavioral data. Leads scoring 70+ are classified as SQLs and automatically trigger HubSpot actions: Create/Update Contact, Create Deal in pipeline, and Assign follow-up task to a sales rep within 24 hours. SQLs get contacted within hours, not days.

System 4: Daily Performance Reporting

Every weekday at 9 AM, the platform generates and distributes reports automatically: CPL, lead volume by source, SQL conversion rate, pipeline value added, channel-specific spend data — posted to Slack and emailed to stakeholders. No more manually pulling reports from five dashboards.

System 5: LinkedIn Form Lead Processing

Webhook trigger fires immediately when a LinkedIn Lead Gen Form is submitted. Lead passes through enrichment → scoring → CRM pipeline automatically. Hot LinkedIn leads are in HubSpot and assigned to a sales rep within minutes of submission.


What You Need to Set This Up

  • n8n Cloud (~$50/month for production)
  • Google Ads API access
  • LinkedIn Marketing API access
  • Clearbit API key (~$100–300/month for enrichment)
  • HubSpot API key (free tier works to start)
  • Slack Incoming Webhooks
  • Google Sheets API and SMTP for reporting

Total estimated cost: ~$150–350/month. Compare to a marketing operations analyst at ₹50,000–80,000/month — who works 9 to 5.

Setup time: 10–15 hours for a technical marketer covering API connections, scoring customization, and testing.


Who This Is Built For

B2B marketing teams running ₹2L+ monthly paid spend on Google Ads or LinkedIn, using HubSpot (adaptable to Salesforce), and struggling with lead response time, data quality, or reporting overhead. Not for early-stage teams — ideal for scale-up mode.


Download the Workflow

The complete Enterprise Marketing Platform workflow is available on my Resources page. The JSON file imports directly into n8n. Documentation covers credential setup, threshold customization, and scoring model adaptation.

Prajesh Meshram is a Senior Marketing Leader with 8+ years building marketing systems for EdTech, SaaS, and enterprise. Download his complete automation workflow library at the Resources page.

Whatsapp bot

WhatsApp Bot Automation for Marketing Teams

Why WhatsApp Is the Most Underutilized Marketing Channel in India

WhatsApp has 500+ million active users in India. Open rates exceed 90%. Response rates average 40–60% — compared to 2–5% for email. Yet most marketing teams still treat it as a manual, ad-hoc channel.

With n8n (an open-source workflow automation platform) and an AI language model, you can build a fully functional, intelligent WhatsApp marketing bot in a weekend — for free.


What This Bot Does

The WhatsApp Bot workflow has five core components: WhatsApp Trigger (listens for incoming messages), AI Agent (processes messages and decides responses), OpenAI Chat Model (powers NLU and response generation), MongoDB Chat Memory (stores conversation history), and Send Message (delivers responses via WhatsApp).


The Technical Stack

n8n is the backbone — self-host for free or use n8n Cloud (~$20/month). WhatsApp Business API via Meta or providers like Twilio, 360dialog, or WATI (~₹5–15 per conversation). OpenAI GPT-4 for language understanding and response generation. MongoDB Atlas (free tier) for conversation memory and context.


Step-by-Step Setup Guide

  1. Set Up n8n: Sign up at n8n.io or self-host with Docker. Create a new workflow with a WhatsApp Trigger node.
  2. Configure WhatsApp Business API: Set up via Meta Business Manager, configure webhook URL to point to your n8n trigger.
  3. Configure the AI Agent: Add AI Agent node, connect to OpenAI Chat Model. Write your system prompt including bot persona, product info, FAQs, escalation rules, and tone guidelines.
  4. Set Up MongoDB Memory: Create free MongoDB Atlas account, add MongoDB Chat Memory node, connect to AI Agent for automatic read/write of conversation history.
  5. Add Send Message Node: Map AI Agent output to message body, set recipient to incoming phone number.
  6. Test and Deploy: Use n8n’s test functionality, send a test message, check execution logs, activate for production.

Marketing Use Cases

Lead Qualification: Bot engages WhatsApp CTA clicks immediately, asks qualifying questions, routes hot leads to sales. Average response time: under 10 seconds, 24/7.

Course Inquiries: Answers common questions about content, duration, pricing, and enrollment — reducing support load.

Post-Purchase Onboarding: Sends welcome messages, collects onboarding info, checks in at Day 3, Day 7, Day 30.

Re-engagement Campaigns: Send outbound messages to opted-in users personalized to their history.


Results You Can Expect

  • Lead response time: From hours to under 30 seconds
  • Lead qualification rate: 3–5x improvement vs. manual follow-up
  • Support ticket deflection: 40–60% of common queries resolved automatically
  • Cost per interaction: ₹5–20 vs. ₹200–500 for human agent handling

Download the Workflow

The complete n8n WhatsApp Bot workflow is available on my Resources page. Import it into your n8n instance and customize the system prompt and credentials for your use case.

Prajesh Meshram is a Senior Marketing Leader and automation practitioner. Visit the Resources page to download his n8n workflow collection.

gemini generated image b1zblrb1zblrb1zb

The GTM Strategy That Reached 30M+ Users

What Does “Go-to-Market” Actually Mean for EdTech and SaaS?

Go-to-market strategy is one of the most overused and underexecuted phrases in marketing. Everyone has a GTM strategy. Very few have one that actually works — one that defines the right audience, delivers the right message at the right moment, and scales without breaking as the product matures.

During my time at Essence (a GroupM agency managing Google’s media), I worked across campaigns that reached 30 million+ users across digital platforms. And in my EdTech roles — where I helped grow the Navneet Education digital business — I had to translate enterprise-grade GTM thinking into resource-constrained startup environments.

Here’s the GTM framework I’ve developed and refined across both worlds.


The Four Pillars of an Effective GTM Strategy

Pillar 1: Audience Architecture

Most GTM strategies fail at the audience definition stage — not because they’re too broad, but because they’re not operationally specific enough. An operationally useful audience definition answers five questions: What problem are they trying to solve right now? What are they currently using to solve it? What does success look like for them in 90 days? Where do they spend time online and offline? What triggers their decision to act?

Pillar 2: Positioning and Messaging Architecture

The messaging architecture I use has three layers: Primary value proposition (the one thing you do better than anyone else), Supporting proof points (3–5 specific, verifiable claims), and Objection-handling messages (the top 3 reasons people don’t buy, and the counter-message for each).

Pillar 3: Channel Strategy and Sequencing

My approach is channel sequencing — launching with 2 channels you can dominate, learning fast, then expanding. Channel 1: Fastest path to your ICP with measurable conversion. Channel 2: Lowest-cost channel with the highest LTV signal. Expansion channels after 60–90 days of data.

Pillar 4: The Launch Sequence and Feedback Loop

Weeks 1–2: Soft launch to existing users. Weeks 3–4: Scale winning messages. Month 2: Full market launch. Month 3+: Ongoing optimization loop.


EdTech-Specific GTM Challenges

EdTech decisions have consideration cycles of 4–12 weeks. Build multi-touch nurture sequences. EdTech buyers are skeptical — build systematic social proof. Allocate 20–30% of budget to top-of-funnel content that creates demand instead of just capturing it.


The Number That Matters: Time-to-Value

The best GTM strategies obsess over one metric most teams ignore: how quickly does the customer get their first meaningful result? Shortening time-to-value is a marketing function as much as a product function.


Key Takeaways

  • Audience architecture must be operationally specific — 5-question framework, not demographics
  • Build a three-layer messaging architecture: primary value prop, proof points, objection handling
  • Sequence channels — dominate 2 first, then expand based on data
  • GTM is a process with a feedback loop, not a launch document
  • Optimize for time-to-customer-value as aggressively as you optimize for acquisition

Prajesh Meshram is a Senior Marketing Leader with 8+ years of experience building and executing GTM strategies for EdTech, SaaS, and Media. Available for Head of Marketing and VP Marketing roles.

gemini generated image 8f67lc8f67lc8f67

How I Built a 15:1 LTV:CAC Engine and Cut CAC by 84%

The Problem Every Growth Marketer Faces

When I joined Genext Students (a Navneet Education vertical) as Senior Manager of Growth Marketing, Customer Acquisition Cost was sitting at ₹4,125 per student. The LTV:CAC ratio was nowhere near sustainable scale.

This is the challenge every Head of Marketing eventually faces: how do you grow faster and more efficiently at the same time? Most teams pick one. I built a system to do both.

Here’s exactly how I engineered a 15:1 LTV:CAC ratio and reduced CAC by 84% — from ₹4,125 to ₹650.


Step 1: Diagnose Before You Prescribe

The first mistake most growth teams make is jumping straight to tactics without understanding why the current CAC is what it is. I spent the first 30 days doing a full funnel audit across every acquisition channel.

What I found: 70% of ad spend was concentrated on channels with the highest volume but lowest conversion-to-paid rate. The highest-converting segments were barely targeted in acquisition. Onboarding drop-off at Day 3 was killing LTV before it could compound.

The insight: we weren’t acquiring the wrong customers — we were acquiring the right customers inefficiently, then failing to activate them properly.


Step 2: Redefine Your “Best Customer” Profile

Most marketing teams define ideal customers by acquisition metrics — who converts cheapest. That’s a trap. I went upstream and defined our ICP by lifetime value: which student segments had the highest course completion rates, the most upsell behavior, and the strongest referral patterns?

Once I had that profile, I reverse-engineered acquisition. Instead of asking “how do we get more signups?”, the question became “how do we get more of these specific people to sign up?” This single shift changed our targeting, creative, channel mix, and landing page messaging — all at once.


Step 3: The Three-Lever Framework for CAC Reduction

Cutting CAC by 84% came from disciplined pressure on three levers simultaneously:

Lever 1: Channel Concentration Efficiency

Reallocated budget from high-volume/low-efficiency channels to the top 2 channels that drove our best-fit customers. Improved creative testing velocity — running 40+ creative variants per quarter — and let data pick winners fast.

Lever 2: Landing Page Conversion Rate Optimization

Every 1% improvement in CVR equals a 1% reduction in CAC. Structured A/B tests across headlines, social proof, form length, and CTA copy moved landing page CVR from 3.2% to 7.8% over 6 months — effectively cutting CPL in half without touching media spend.

Lever 3: Retargeting and Warm Audience Nurturing

Built a 5-stage retargeting funnel from awareness to paid with distinct creative at each stage. Warm retargeting CAC came in at 60% below cold acquisition CAC.


Step 4: Compounding LTV While Cutting CAC

The ratio matters more than either number in isolation. While cutting CAC, I ran a parallel track to improve LTV:

  • Onboarding redesign: 7-day activation sequence (email + in-app) increased Day-30 retention by 34%
  • Upsell engine: Identified behavioral triggers (lesson completions, quiz scores) that predicted upsell readiness, then automated contextual upgrade offers
  • Referral program: Launched peer referral program tied to course milestones, generating 22% of new paid signups at near-zero acquisition cost

Result: average student LTV increased by 2.3x over 18 months while CAC dropped by 84%. That’s how you build a 15:1 LTV:CAC ratio.


Step 5: Build the Measurement Infrastructure First

None of this works without proper attribution. Before optimizing anything: multi-touch attribution across all channels, cohort-based LTV tracking, weekly CAC dashboards by channel and creative, and real-time conversion funnel monitoring with alert thresholds.


What a 15:1 LTV:CAC Ratio Actually Means for the Business

When your LTV:CAC ratio crosses 3:1, investors get excited. At 15:1, the business can reinvest aggressively and expand into new markets without sacrificing unit economics. More importantly, it proves that marketing isn’t a cost center — it’s the growth engine of the business.


Key Takeaways

  • Audit before you optimize — understand why CAC is high before fixing it
  • Define your ICP by LTV, not just acquisition metrics
  • Apply the three-lever framework: channel efficiency, CVR improvement, warm retargeting
  • Improve LTV in parallel — the ratio is what matters
  • Build measurement infrastructure before optimizing anything

Prajesh Meshram is a Senior Marketing Leader with 8+ years of experience driving growth in EdTech, SaaS, and Media. Currently open to Head of Marketing and VP Marketing opportunities.

team reviewing marketing strategies on digital screen

Building High-Performance Marketing Teams: A Framework for Scale

What Separates a Marketing Team from a Marketing Engine

Most marketing teams are collections of specialists executing tasks. A high-performance marketing team is something different — it’s a system where strategy, execution, and measurement reinforce each other in a continuous loop, and where every person understands how their work connects to business outcomes.

In 8+ years of marketing leadership — across EdTech, SaaS, digital media, and enterprise — I’ve built and scaled marketing functions from scratch, inherited underperforming teams, and had to rebuild culture mid-cycle. Here’s the framework I use to build teams that consistently outperform.


The Hire: Capability vs. Curiosity

The biggest hiring mistake in marketing is optimizing for credentials. The second biggest is hiring for current skill sets without accounting for how fast the landscape changes.

The profile I look for in marketing hires has three non-negotiables:

  1. Intellectual curiosity: Do they actually read about marketing outside of work? Do they experiment on their own? Curiosity predicts adaptability, and marketing rewards adaptability above almost every other trait.
  2. Data literacy: Not data science — data literacy. Can they read a dashboard, form a hypothesis, and design a test to validate it? Can they distinguish between correlation and causation in campaign results?
  3. Business orientation: Do they think in revenue and margin, or in impressions and clicks? The best marketers I’ve worked with are obsessed with business outcomes, not marketing vanity metrics.

Craft skills — copywriting, media buying, SEO, design — are important but learnable. The three traits above are much harder to develop in someone who doesn’t already have them.


The Structure: Pods Over Silos

Traditional marketing team structures create silos: SEO team, paid team, content team, email team — each optimizing for their own channel metrics, rarely talking to each other.

I prefer a pod structure organized around customer journeys or business units. Each pod owns a full funnel — awareness through retention — for a specific audience segment or product line.


The Culture: Experiments Over Opinions

Marketing teams waste enormous energy debating opinions. The best teams I’ve built have a strong cultural norm: opinions need to become hypotheses, and hypotheses need to be tested.

When your team runs 30–40 experiments per quarter, you compound learning fast. The team that’s run 200 experiments has a fundamentally better understanding of their customer than the team that’s run 20.


The Rhythm: OKRs, Weeklies, and Quarterly Reviews

Every quarter, each pod sets 2–3 Objectives with 3–5 measurable Key Results each. Weekly funnel reviews keep everyone aligned. Monthly 1:1s drive development. Quarterly retrospectives drive continuous improvement.


The Measurement: Everyone Owns a Number

The fastest way to create accountability in a marketing team is to make sure every person can point to a specific metric they own. Not the team’s metric — their metric.


Key Takeaways

  • Hire for curiosity, data literacy, and business orientation — skills are learnable
  • Structure teams in pods aligned to customer journeys, not channel silos
  • Build an experiment-first culture where opinions become testable hypotheses
  • Give every person a number to own — accountability scales with clarity

Prajesh Meshram is a Senior Marketing Leader with 8+ years of experience in EdTech, SaaS, and Media. IIM Raipur alumnus. Open to VP Marketing and Head of Marketing roles.

Detailed close-up of a hand pointing at colorful charts with a blue pen on wooden surface.

Genext Students (Navneet Education)

Genext Case Study - Prajesh Meshram

How I Reduced CAC by 84% Through Customer-Led Product Marketing

Transforming an EdTech B2B product from high-cost acquisition to profitable growth
Senior Manager Growth Marketing | Sep 2022 - Sep 2023
84%
CAC Reduction
15:1
LTV:CAC Ratio
40%
Conversion Lift
₹10-12L
Monthly Budget

⚠️ The Challenge

Genext Students, an EdTech B2B product targeting tuition center owners, was burning cash on customer acquisition. With a CAC of ₹4,725 against an LTV of ₹10,000, the unit economics were unsustainable. The team was spending on the wrong channels, using generic messaging, and losing leads due to manual handoff delays. My mandate: Fix the economics or shut down the marketing engine.

🎯 The Strategy

Phase 1: Customer Research (Month 1-2)

Interviewed 50+ tuition center owners to understand their behavior, pain points, and decision-making process.

  • Key Insight: Our ICP was tuition owners with 30+ students per class
  • They spent time on social media, not searching for solutions on Google
  • Price and operational efficiency mattered more than features

Phase 2: Channel Optimization (Month 2-3)

Tested intent-based platforms (Google Ads) vs. social media (Facebook/Instagram).

  • Google Ads failed: ₹8,000+ cost per lead
  • Facebook/Instagram won: ₹1,200 cost per lead
  • Rationale: Interrupt where they already spend time, don't wait for intent

Phase 3: Creative & Messaging Testing (Month 3-6)

Ran systematic A/B tests across multiple dimensions:

  • Character style: Illustrations beat human figures (23% better CTR)
  • Language: Regional languages (Hindi/Gujarati) beat English (31% better conversion)
  • Message focus: Pricing-led messaging beat features (18% better conversion)

Phase 4: Marketing Automation (Month 4-8)

Built Facebook → Zapier → Salesforce automation to eliminate manual lead handoff.

  • Reduced lead-to-call time from 5 minutes to 3 minutes (40% improvement)
  • Automated regional routing (leads to correct sales rep by geography)
  • Result: 40% improvement in conversion rates

📊 The Results

₹4,725 → ₹650
84% CAC Reduction
15.4:1
LTV:CAC Ratio Achieved

+40%
Conversion Rate Lift
70 → 74
Daily Conversions

đź’ˇ Key Learnings

  • Customer research beats assumptions every time. Talking to 50+ users revealed our audience wasn't on Google—they were on Facebook.
  • Channel fit matters more than "best practices." What works for B2B SaaS doesn't work for Indian tuition owners.
  • Regional localization is non-negotiable in India. Hindi and Gujarati messaging drove 31% better conversion than English.
  • Automation creates compound returns. Reducing lead handoff time by 2 minutes improved conversion by 40%.
  • Simple qualification beats complex scoring. Our binary filter (30+ students) outperformed sophisticated lead scoring models.